By default, the Summary Tab shows Column Groups Bid Areas. Even if you do not use Bid Areas in your bid, the program assigns all takeoff to "Page Areas" so the Summary Tab always groups by "Bid Areas Tier 1" (by default, you can remove that grouping if you want). The program also groups by "Bid Areas Tier 2" and "Bid Areas Tier 3", if you use nested Bid Areas (see Related Articles for more information Bid Areas).
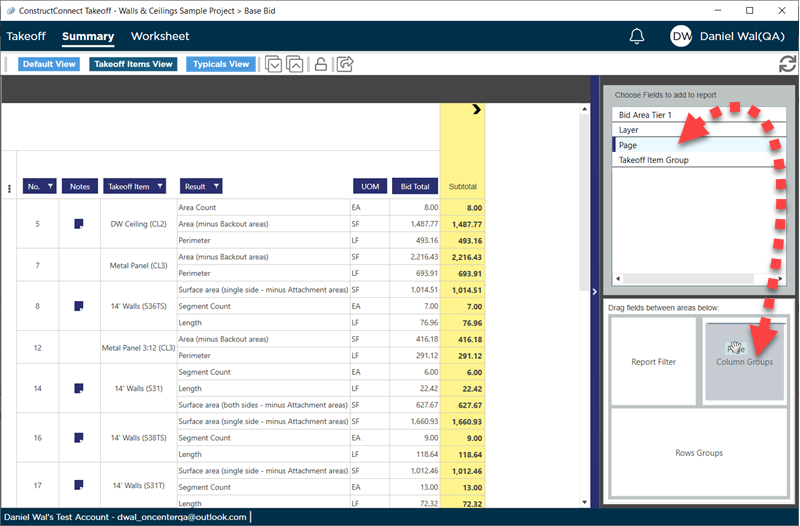
We want to create Column Groups for each Page (Sheet) in our bid. So, we begin by removing the Bid Areas Tier 1 Field from the Column Group box. To remove an existing Column Group (such as Bid Areas Tier 1, 2, or 3), you can either click the X next to the Field name, or drag the field out of the Column Groups box.
Then, we drag "Page" from the Choose Fields... box into the Column Groups box in the lower section.
Now you can click on the > in the yellow Sub Total column to expand the columns to the right.
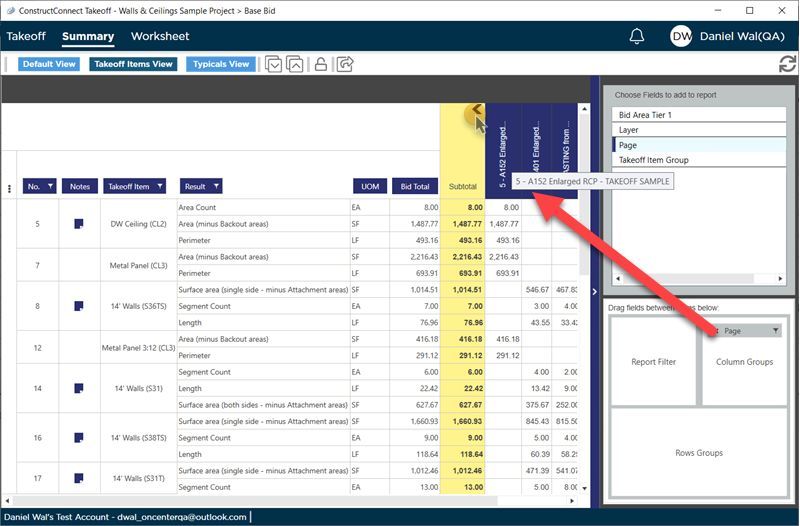
A column is added for every Page (Sheet) on which takeoff has been drawn. We are going to explain "Row Groups" in just a few articles - you may want to show Pages as Rows and keep Bid Areas as Columns or switch the two - whatever works best for you is how you should use the program.
To maximize the number of columns you can see, click the > in the blue vertical bar that separates the grid from the Pivot Table Controls.
Expanding Sub Columns
By Default, when you click the control at the top of the Sub Total column to explain the columns to the right, if you have grouped by Bid Areas Tier 1, 2, and 3, only Tier 1 is shown.
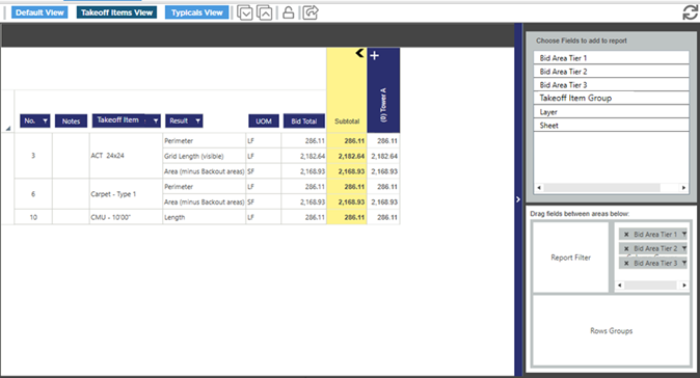
To expand one of the 1st Tier Bid Areas, click the + in the Column header.
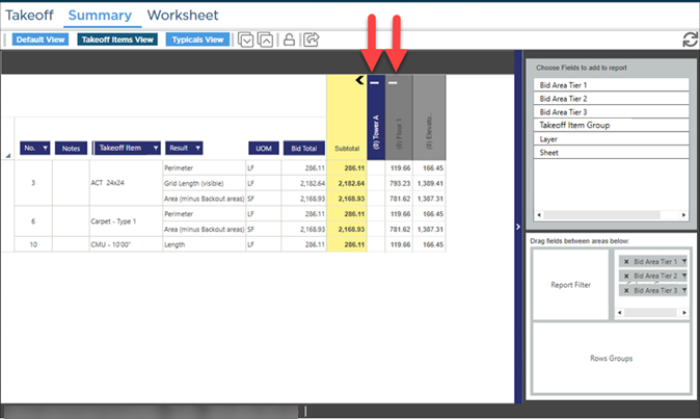
The broken out values for each Takeoff Item and Bid Area are displayed now. This allows you to pinpoint the amount of takeoff allocated to each Bid Area or sub-Bid Area, depending on the Expand/Collapse state of the columns.
Any Bid Areas that show the plus sign in their header contain sub-Areas.
We cover filtering Column Groups in the next article.
So, what should we add as Column Groups? Well, here you have to put some thought into how you want to see your information. Technically, you can add all the available Fields as a Column Groups, but ask yourself if adding a field will it make the data easier to use/understand or just add complexity.
Just like other filtering and grouping options, too much can be too much - use whatever criteria makes the data make sense to you.
Filtering, Grouping, and Resetting
You can put Filtering, Column Grouping, and Row Grouping (see Related Articles) together. Experiment with the results but understand you can filter and group your data so much that it becomes unusable.
If you get to a point where you cannot make sense of the Summary Tab, just click the  button at the top of the screen to reset the grid to defaults and start filtering/grouping again.

 Filtering the Summary Tab Using the Pivot Table Controls (Report Filters)