The Pivot Table or "Filtering and Grouping" controls are in a panel on the right side of the Summary Tab. These tools allow you to filter and group by dragging and dropping and sub-filtering various fields.
The available Fields by which you can group and filter the grid are shown in the upper right "Choose Fields..." box. You drag and drop these files in or out of the boxes in the lower section to filter or create column or row groups.
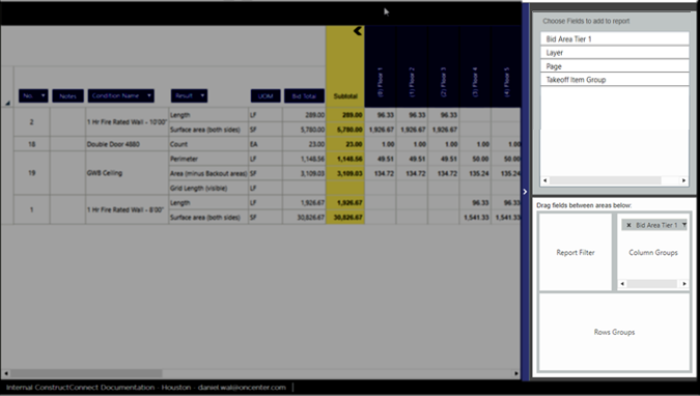
By default, the Summary Tab is set to Column Grouping using "Bid Area Tier 1", which shows the breakdown of all Tier 1 Bid Areas in columns to the right of the yellow "Subtotal" column in the grid.
Notice:
- Only "Bid Area Tier 1" is shown in the "Choose Fields..." section of the Pivot Table Controls. That's because this particular Bid does not utilize any sub-Area. If there are Tier 2 or Tier 3 Bid Areas used in the Bid, then they would show in the "Choose Fields..." section too.
- "Bid Area Tier 1" has been dragged into the "Column Groups" section of the Pivot Table Controls. (Remember, this is the default layout of the Summary Tab.)
Report Filters (Filtering the Grid using the Pivot Table)
There are two ways to filter the grid using the Pivot Table Controls. The Report Filter, explained below, and the Column Group Filter, explained in Filtering Column Groups.
Report Filtering is similar to Column Header Filtering. Column Header Filtering is great for those Columns that contain different values, such a Takeoff Item Group or even Page or Result. However, you may want to filter your view to show you only Results from, say "Floor 1" in your Bid without using Row or Column Grouping.
To use the Report Filter, Drag-n-Drop one of the Fields from the top section into the "Report Filter" section in the bottom panel. If you want to filter by Bid Area Tier 1, just grab it and move it from the "Column Groups" box to the "Report Filter" box. (See Related Articles if you want to preserve the Bid Area Column Groups and apply a Bid Area filter.)
Applying a Report Filter
For our example, we want to see all the takeoff that exists on a particular Page so...
- Drag and drop "Page" into the Report Filter box.
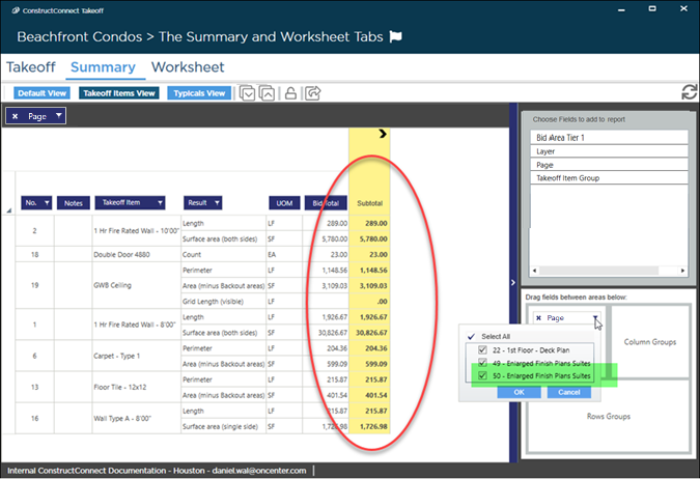
- Now, click the
 button in the "Page" filter field box. The program shows you all available records for this field, in our example, every Page on which takeoff exists in our Bid.
 - Uncheck all but the the last Page (you can use the Select and Deselect All toggle at the top to unselect all and then just put a check mark in that Page's row).
- Click OK.

The grid updates to show us just the Takeoff Items and values present on the selected Page.
That is because the criteria we selected, Page, is not unique to a Takeoff Item. A Takeoff Item can be (and often is) used on multiple Pages. The Bid Total column displays the cumulative total for the Takeoff Item (across all Pages) and the Subtotal column displays the filtered results (in our example, the total for the selected Page). Same goes for Bid Areas - a Takeoff Item can be used to draw takeoff in many Bid Areas so when you filter by Bid Area, the Bid Total and Subtotal columns likely will not display the same value.
Criteria such a Layer or Takeoff Item Group are unique per Takeoff Item (you can't allocate some of a Takeoff Item's takeoff to X Layer and the rest to Y Layer, for example) so you would not see a difference between Bid and Subtotal if you filtered by one of those.
See Why Don't The Bid Total, Sub Total, and Column Group Values Match? for more information.
Pivot Table filtering is persistent until cleared (unlike Column Header Filtering). This means the filter continues to be applied, even if you switch to the Takeoff or Worksheet Tabs, close the Bid, or even close the program. When you come back to this Bid's Summary Tab, the Filter is still applied. You can tell that the Summary Tab is filtered by the dark filter bar at the top of the Tab.
It is important to remember that these filters aren't cleared automatically. Make sure you are reporting correct values not an incorrect, filtered value. To remove all filters quickly, click the  button at the top of the Tab.
Removing a Report Filter
To remove a Report Filter, click the "X" in the field or drag it out of the Report Filter box.
When you apply or remove a Report Filter, the grid is updated immediately.

 Summary Tab: Basic Filtering by Column Header